Market Volatility: Call replay with CIO Eric Freedman
Dial: 888-566-0439
Passcode: 3485

Key takeaways
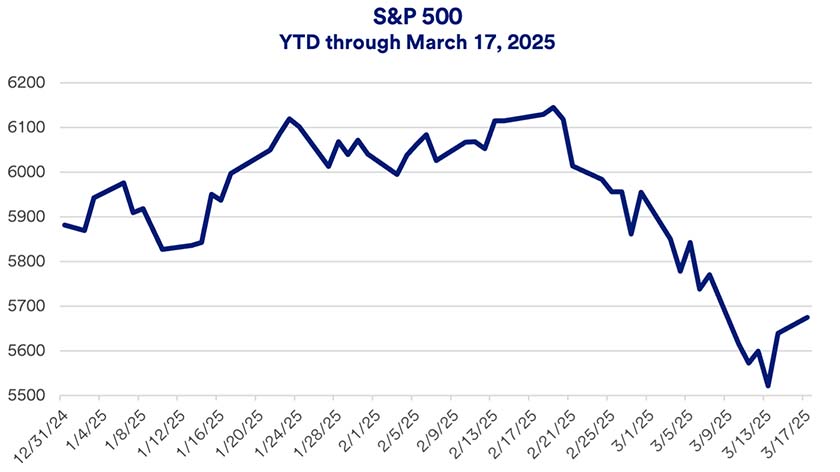
In early March 2025, U.S. stocks crossed into correction territory, marking a 10% drop from peak levels.
The market’s decline appears to reflect uncertainty surrounding new Trump administration tariff policies and growing economic concerns.
After leading the stock market for the last two years, so far in 2025, the technology sector is lagging the broader S&P 500 Index.
For the first time since 2023, the S&P 500 finds itself in market correction territory. Last week, the index fell 10% below all-time peak levels reached a little more than three weeks earlier.1 The rapid decline caught some investors by surprise, particularly given the favorable underlying conditions U.S. stocks carried into 2025.
Markets appeared to be reacting in large part to potential economic consequences from new Trump administration policies. Most notable are new trade policies centered on increasing tariffs for goods imported to the U.S.
“Uncertainty is the driver around the market’s recent selloff. There are growing concerns about potential economic weakness, due in part to tariff impacts.”
Rob Haworth, senior investment strategy director, U.S. Bank Asset Management
“Uncertainty is the driver around the market’s recent selloff,” says Rob Haworth, senior investment strategy director for U.S. Bank Asset Management.

“There are growing concerns about potential economic weakness, due in part to tariff impacts,” says Haworth “Volatility is probably in the cards for at least the next couple of weeks and could extend beyond that depending upon what the back-and-forth looks like when it comes to tariffs,” says Haworth.
As of this week, the S&P 500 is on track to decline for the fourth month since October 2024.
Markets fluctuated through most of 2025’s first quarter. Nevertheless, by February 19, the S&P 500 gained 4.5%, rising to an all-time high. In the month since, the index surrendered those gains and retreated further. Year-to-date through March 17, the S&P 500’s total return is down 3.23%. This follows two years of 25%+ S&P 500 total returns.1
Despite the market’s gyrations many underlying fundamentals are, for the time being at least, positive. “Consumers are in a good spot, companies are flush with cash,” says Eric Freedman, chief investment officer for U.S. Bank Asset Management. “How we endure change will be important, but we’re starting from a position of strength.”
The recent focus on new tariff policies is a critical market factor, according to Freedman. “There’s been a lot for the market to absorb with the on-and-off status of tariffs, their size, the countries affected and mechanisms by which tariffs will be enacted.” Freedman says the pace of change has given companies and consumers a lot to take in over a short period of time.
In addition, Trump’s policy shifts on the Russia-Ukraine war, temporarily pausing U.S. financial support for Ukraine, heightened geopolitical concerns. This too contributed to further investor uncertainty.
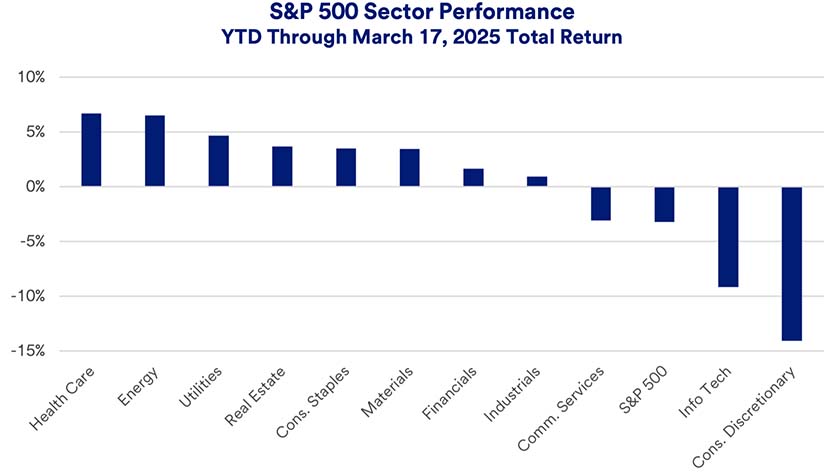
The same three sectors that drove stellar 2023 and 2024 S&P 500 performance, information technology, communication services and consumer discretionary stocks, now weigh the market down. The three sectors account for 50% of the S&P 500’s market capitalization. All three are in negative territory year-to-date, with particularly sharp drops for information technology and consumer discretionary stocks.1

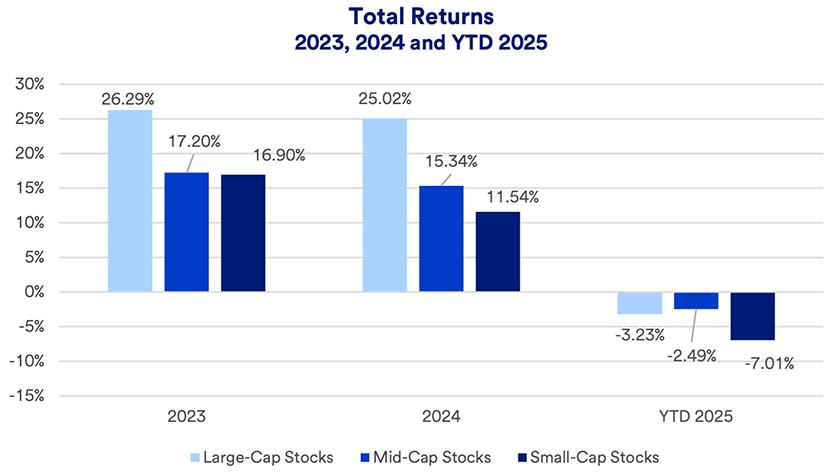
Similarly, performance by market capitalization has also shifted. In 2023 and 2024, large cap stocks significantly outpaced mid-cap and small-cap stocks. In 2025, stocks are down across the board. Small-cap stocks are underperforming the other two categories, mid-cap stocks have held up best.2

Even as the U.S. stock market struggles, global equities are in positive territory year-to-date. Through March 17, 2025, the MSCI EAFE Index, a measure of foreign developed market large-cap stock performance, generated a 10.8% total return, a 14% performance advantage over the S&P 500.3 “We’re seeing better equity market sentiment outside of the U.S.,” says Haworth. “This is fueled in part by proposed increases in fiscal spending, particularly for defense purposes in light of an apparent U.S. pullback in support of NATO allies.”
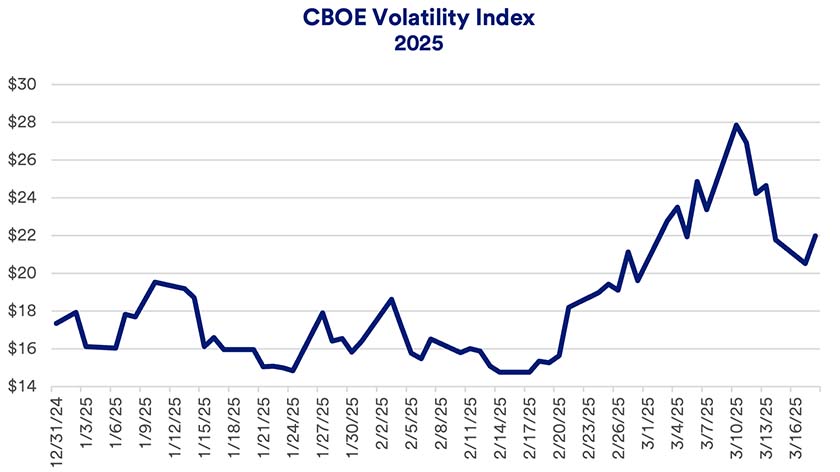
Escalating volatility is a notable market dynamic so far this year. The CBOE’s Volatility Index is considered a critical market volatility measure. It is often referred to as the “fear index.” Haworth says the VIX rising into the 20+ range indicates weaker market sentiment. The gauge peaked above 27 just before the market fell into correction territory. It has since retreated, but remains above 20.4

The University of Michigan’s Consumer Sentiment Index dropped 11% in March from February, and 27% below its year-ago level.5 It’s not clear whether flagging consumer sentiment is a harbinger of subsequent economic performance. Recent economic concerns contrast with previously solid, economic expansion including 2023’s 2.9% Gross Domestic Product (GDP) growth and 2024’s 2.8% GDP growth.6
With consumers and businesses currently on fundamentally solid ground, at what point might current concerns related to shifting tariff policies alter economic dynamics? “If trade wars result in a higher cost of doing business, that would ultimately impact underlying fundamentals,” says Haworth. “A concern is that if the U.S. and other countries get caught up in implementing retaliatory tariffs, it could ultimately slow economic activity worldwide.”
Haworth is looking for economic clues in corporate earnings forecasts. “The market at this point is left to evaluate what multiple they should put on stocks and assess earnings expectations,” says Haworth. He notes that to date, analyst forecasts have not significantly decreased 2025 earnings expectations from previous levels, but that could change depending on the impact of tariffs.
Despite recent challenges, investors may wish to consider an equity overweight allocation, trimming fixed income positions within a diversified portfolio. “Our position is to own a globally diversified equity portfolio, not specifically focusing on U.S. stocks or particular sectors,” says Haworth.
“We still think it’s a great time to be invested and for those with money in cash, it represents an opportunity to put capital to work in longer-term assets,” says Freedman. He encourages investors to view markets with a long-term lens. “Timing the markets and trying to be precise on when to be in and when to be out is challenging,” says Freedman. “Investors should be aware there’s a lot of noise. We urge clients to take a deep breath, go back to your plan. That will increase your odds of success.”
This is an important time to check in with a wealth planning professional to make sure you’re comfortable with your current investments and that your portfolio is structured in a manner consistent with your time horizon, risk appetite and long-term financial goals.
The S&P 500 Index consists of 500 widely traded stocks that are considered to represent the performance of the U.S. stock market in general. Diversification and asset allocation do not guarantee returns or protect against losses. The Russell MidCap Index provides investors with a benchmark for mid-sized companies. The index, which is distinct from the large-cap S&P 500, is designed to measure the performance of mid-sized companies, reflecting the distinctive risk and return characteristics of this market segment. The Russell 2000 Index refers to a stock market index that measures the performance of the 2,000 smaller companies included in the Russell 3000 Index.
Stocks are shares of publicly traded companies can be bought and sold. These transactions occur on exchanges and over-the-counter (OTC) marketplaces. The activity of pricing, buying and selling stocks is all activity that occurs in what is generally called “the stock market.”
Stocks frequently move up and down. Between November 2023 and November 2024, the stock market trended higher (following a generally downward trend between August and October 2023), except for modest setbacks in April, October and December 2024, and another negative month in February 2025.1 Solid U.S. economic growth, which helped boost corporate earnings, is still a key to ongoing market performance. New Trump administration policies, particularly those with an economic impact, are another consideration. Federal Reserve (Fed) interest rate policy can also impact markets. The Fed held the target federal funds rate at a top level of 5.50%. In September, November, and December 2024, the Fed cut interest rates a total of 1.0%, its first rates cut in more than four years. However, the Fed scaled back expectations for 2025, projecting just two additional rate cuts in the new year.7 “The Fed’s interest rate stance is a prime consideration for equity investors in today’s market,” says Haworth.
These three indices are frequently quoted on daily news reports reflecting daily performance of the stock market. The Dow Jones Industrial Average, perhaps the most quoted index, reflects the performance of 30 prominent stocks listed on U.S. exchanges. The Standard & Poor’s 500 tracks a broader universe of 500 large U.S. stocks. The NASDAQ Composite Index provides a measure of performance of 2,500 stocks listed on the National Association of Securities Dealers (NASD) Automated Quotations exchange. These represent small-, mid- and large-cap stocks. Investors often track these indices, particularly over time, to measure broader stock market performance.
With the market and economy in flux, how should investors position their portfolios to capitalize on potential opportunities, while guarding against risks?
We can partner with you to design an investment strategy that aligns with your goals and is able to weather all types of market cycles.